
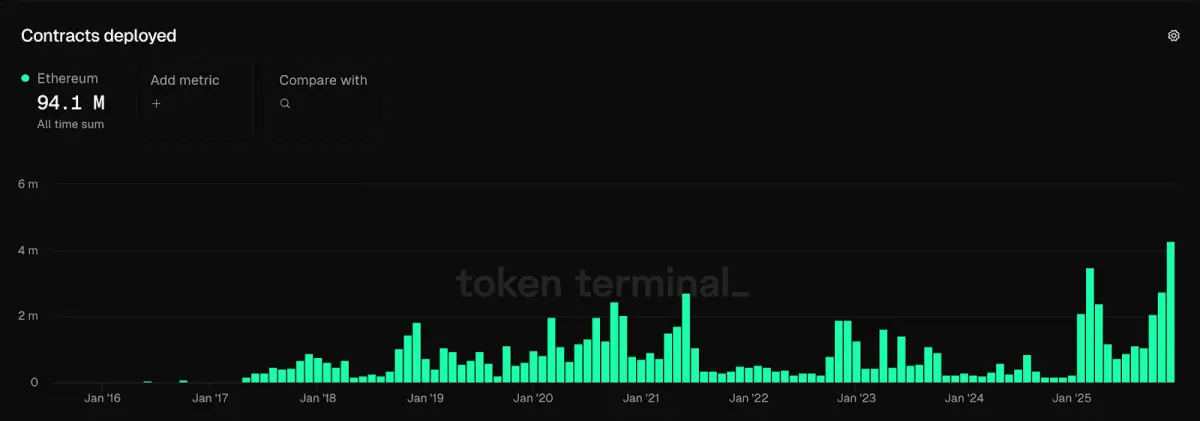
Ethereum’s mainnet witnessed its largest-ever smart contract deployment in a month, according to data tracked by Token Terminal.
In December 2025, ETH developers launched 4.3 million contracts atop Ethereum’s layer-1 chain, bringing the cumulative figure to $94.10 million. That broke the March 2025 record of 3.5 million smart contract deployments.
Fusaka Upgrade Behind Smart Contract Surge?
Ethereum’s record smart contract deployments in December 2025 coincided with the Fusaka upgrade. Fusaka aimed to expand data capacity and improve scaling economics for Layer-2 networks.
Its PeerDAS direction focused on handling more data without raising validator burdens too much. That typically reduces congestion and improves throughput. For developers, that means lower friction to deploy and update contracts.
Deployments are cost-sensitive. When the network runs more smoothly, teams ship more versions and launch more contracts, including factory-style deployments.
The surge also fit a broader Q4 build cycle across Ethereum, which saw 8.7 million contracts deployed, but December still stood out.
Token Terminal data shows Ethereum is now the 4th-largest L1 by all-time contract deployments at 94.1 million, trailing Polygon (~397.5 million), BNB Chain (~356.8 million) and TON (~172.3 million).
More deployed contracts usually mean more apps, new features, and fresh liquidity rails coming online. That can later translate into higher user activity, more transactions, and stronger fee and MEV generation.
Over time, that expansion in economic activity can feed into Ethereum’s value capture and, in turn, its price performance.
Ethereum, for instance, remains the leading venue for real-world asset tokenisation, capturing the largest share of the on-chain RWA market cap. RedStone researchers describeit as the institutional default, citing its security, deep liquidity, and mature infrastructure.
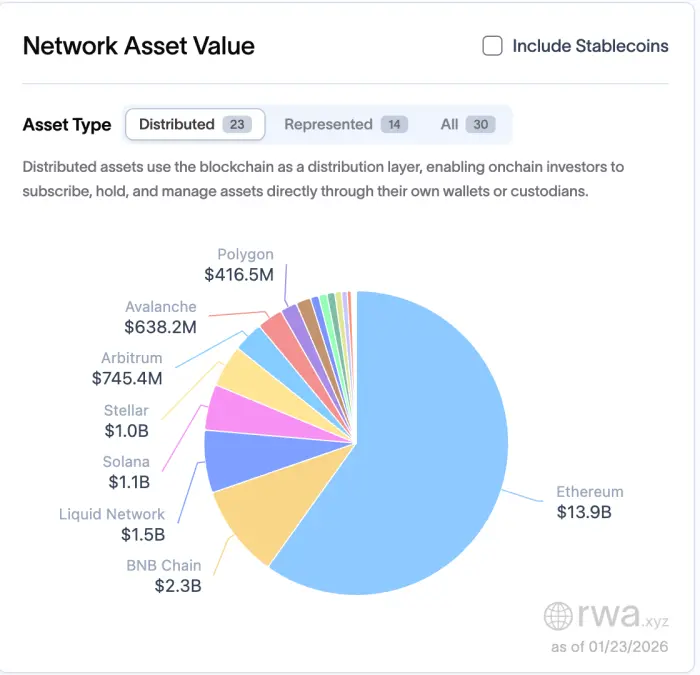
It also anchors stablecoin liquidity. RWA.XYZdata shows Ethereum hosts more than half of the roughly $307 billion stablecoin market, dominated by Tether’s USDT and Circle’s USDC.
Ethereum’s ecosystem active addresses (unique addresses interacting with on-chain apps over a 30-day window) further climbed to about 8.9 million in the latest reading. That shows the December deployment burst coincided with a broader pickup in real user activity across Ethereum and its Layer-2 stack.


